The best companies acknowledge that it's not enough for products to make money or to delight customers. Successful products have to delight customers in ways that also generate business value. For that reason, Product Managers have to be experts in the customer and also the different facets of the business. A good Product Manager is the CEO of the product; they are the experts in knowing the product, the customer, end users, the market, and the competition really well.
As a Product Manager, your team typically does not report to you; therefore, you cannot dictate terms to get things done. You must influence your colleagues and inspire them to rally behind the vision and strategy that you are pursuing. The need to influence without authority means that building trust is crucial. You cannot be an effective Product Manager without the trust of your team and your stakeholders in the business. You must be able to speak each of their languages and show them that you understand their goals, needs, and perspectives.
How product organisations are structured
An organisation's product, ethos, and culture arise from how it structures its product teams. Teams tend to skew towards either top‑down decision-making, starting from a product vision, or bottom‑up decision-making, starting from insights from customers and users. The best teams combine both, using autonomous, empowered, cross‑functional teams and setting clear metrics that those teams can use to measure themselves.
Vision, Strategy and Focus
All organisations have a vast array of choices regarding their products. Most organisations have many different types of customers that they can serve. Each of those customer groups has all sorts of problems they are looking to solve, and there are many ways to solve each of those problems. But how do organisations identify which customers, concerns, and solutions to pursue?
The first way is by setting a vision and strategy. Developing a clear vision and strategy focuses the organisation and its teams on some things to the exclusion of others. If you are a product leader, defining an inspiring product vision and a clear strategy is hugely important. It will be a major influence on how your Product Managers act on your behalf.
Your vision must be grounded in some fundamental insights about what your customers want. Likewise, your strategy must be informed by insights.
In the CEO of the product philosophy, the product team is empowered to solve customers' problems in ways they think are best because they are closest to the customer. As a result, companies that adopt this model will typically set metrics for each team that flow from the product strategy. These metrics serve as a north star for the team to measure their success against, enabling them to determine if their solutions are working.
The impact mapping framework is a collaborative, strategic planning technique that takes a high‑level goal, the stakeholders that can influence or are influenced by the goal, and the impact or behaviour changes we hope to facilitate for those stakeholders. Framing deliverables in this way makes it relatively easy to define metrics to assess the success of a new product or feature based on the desired impact.
Design Thinking
The design thinking process follows five phases:
- Empathise
- Define
- Ideate
- Prototype
- Testing
The empathise phase is all about building empathy with your users. This can mean talking with users, observing them or immersing yourself in their environment to gain insights into their perspective.
The define phase structures the insights you've gained from the empathise phase. You can synthesise your findings into documents like user personas and empathy maps. These form a body of knowledge that you and your team can refer back to as a reminder to walk in your user's shoes. In addition to structuring insights around your target user, you also want to outline what insights you have generated about the problems your users want to be solved. Your ultimate goal for this phase is to craft a human-centred problem statement, a problem in your users' words that you are going to attempt to solve.
The ideate phase is all about challenging your assumptions and creating ideas for innovative solutions to the problem statement. One way to start is to take everything you've learned from the previous phases and write out 'how might we...?' statements. Another helpful technique is 'crazy eights', where you sketch eight ideas on a sheet of paper in as many minutes. This rapid-fire sketching forces you to move beyond the initial idea or ideas you have in your head to consider other alternatives.
Once you have come up with some ideas, you need to converge on a single, cohesive idea that effectively solves your users' problems. An effective way to do this is to develop a number of prototypes. Prototypes can be developed cheaply and quickly, so you can iterate based on the insights you gather.
The final phase, testing, gets your prototype in front of users so you can see how they interact with it.
Prioritisation
As a Product Manager, you are faced with all sorts of constraints; time, money, and capabilities, and ultimately you need to decide how to spend your resources most wisely. To make matters even more complicated, you never have perfect information to make decisions. So, while you'll need to decide whether to build feature A or feature B, you'll also need to decide whether to explore idea C or idea D or invest more time in customer discovery or ideation.
Balancing the different factors that play into your product investment decisions is hard.
- Do you spend time fixing bugs or building the next great thing?
- Do you cater to the whims of a big enterprise client or dozens of smaller clients that each brings in a fraction of the enterprise client's revenue?
- Do you bet big on moonshots or play things safe through optimisations?
- Do you spend time building for scale or moving as fast as possible?
Opportunity-Solution Tree
An opportunity-solution tree is a way to visualise potential avenues you could take from your desired outcome through opportunities, possible solutions, and experiments to test those solutions.
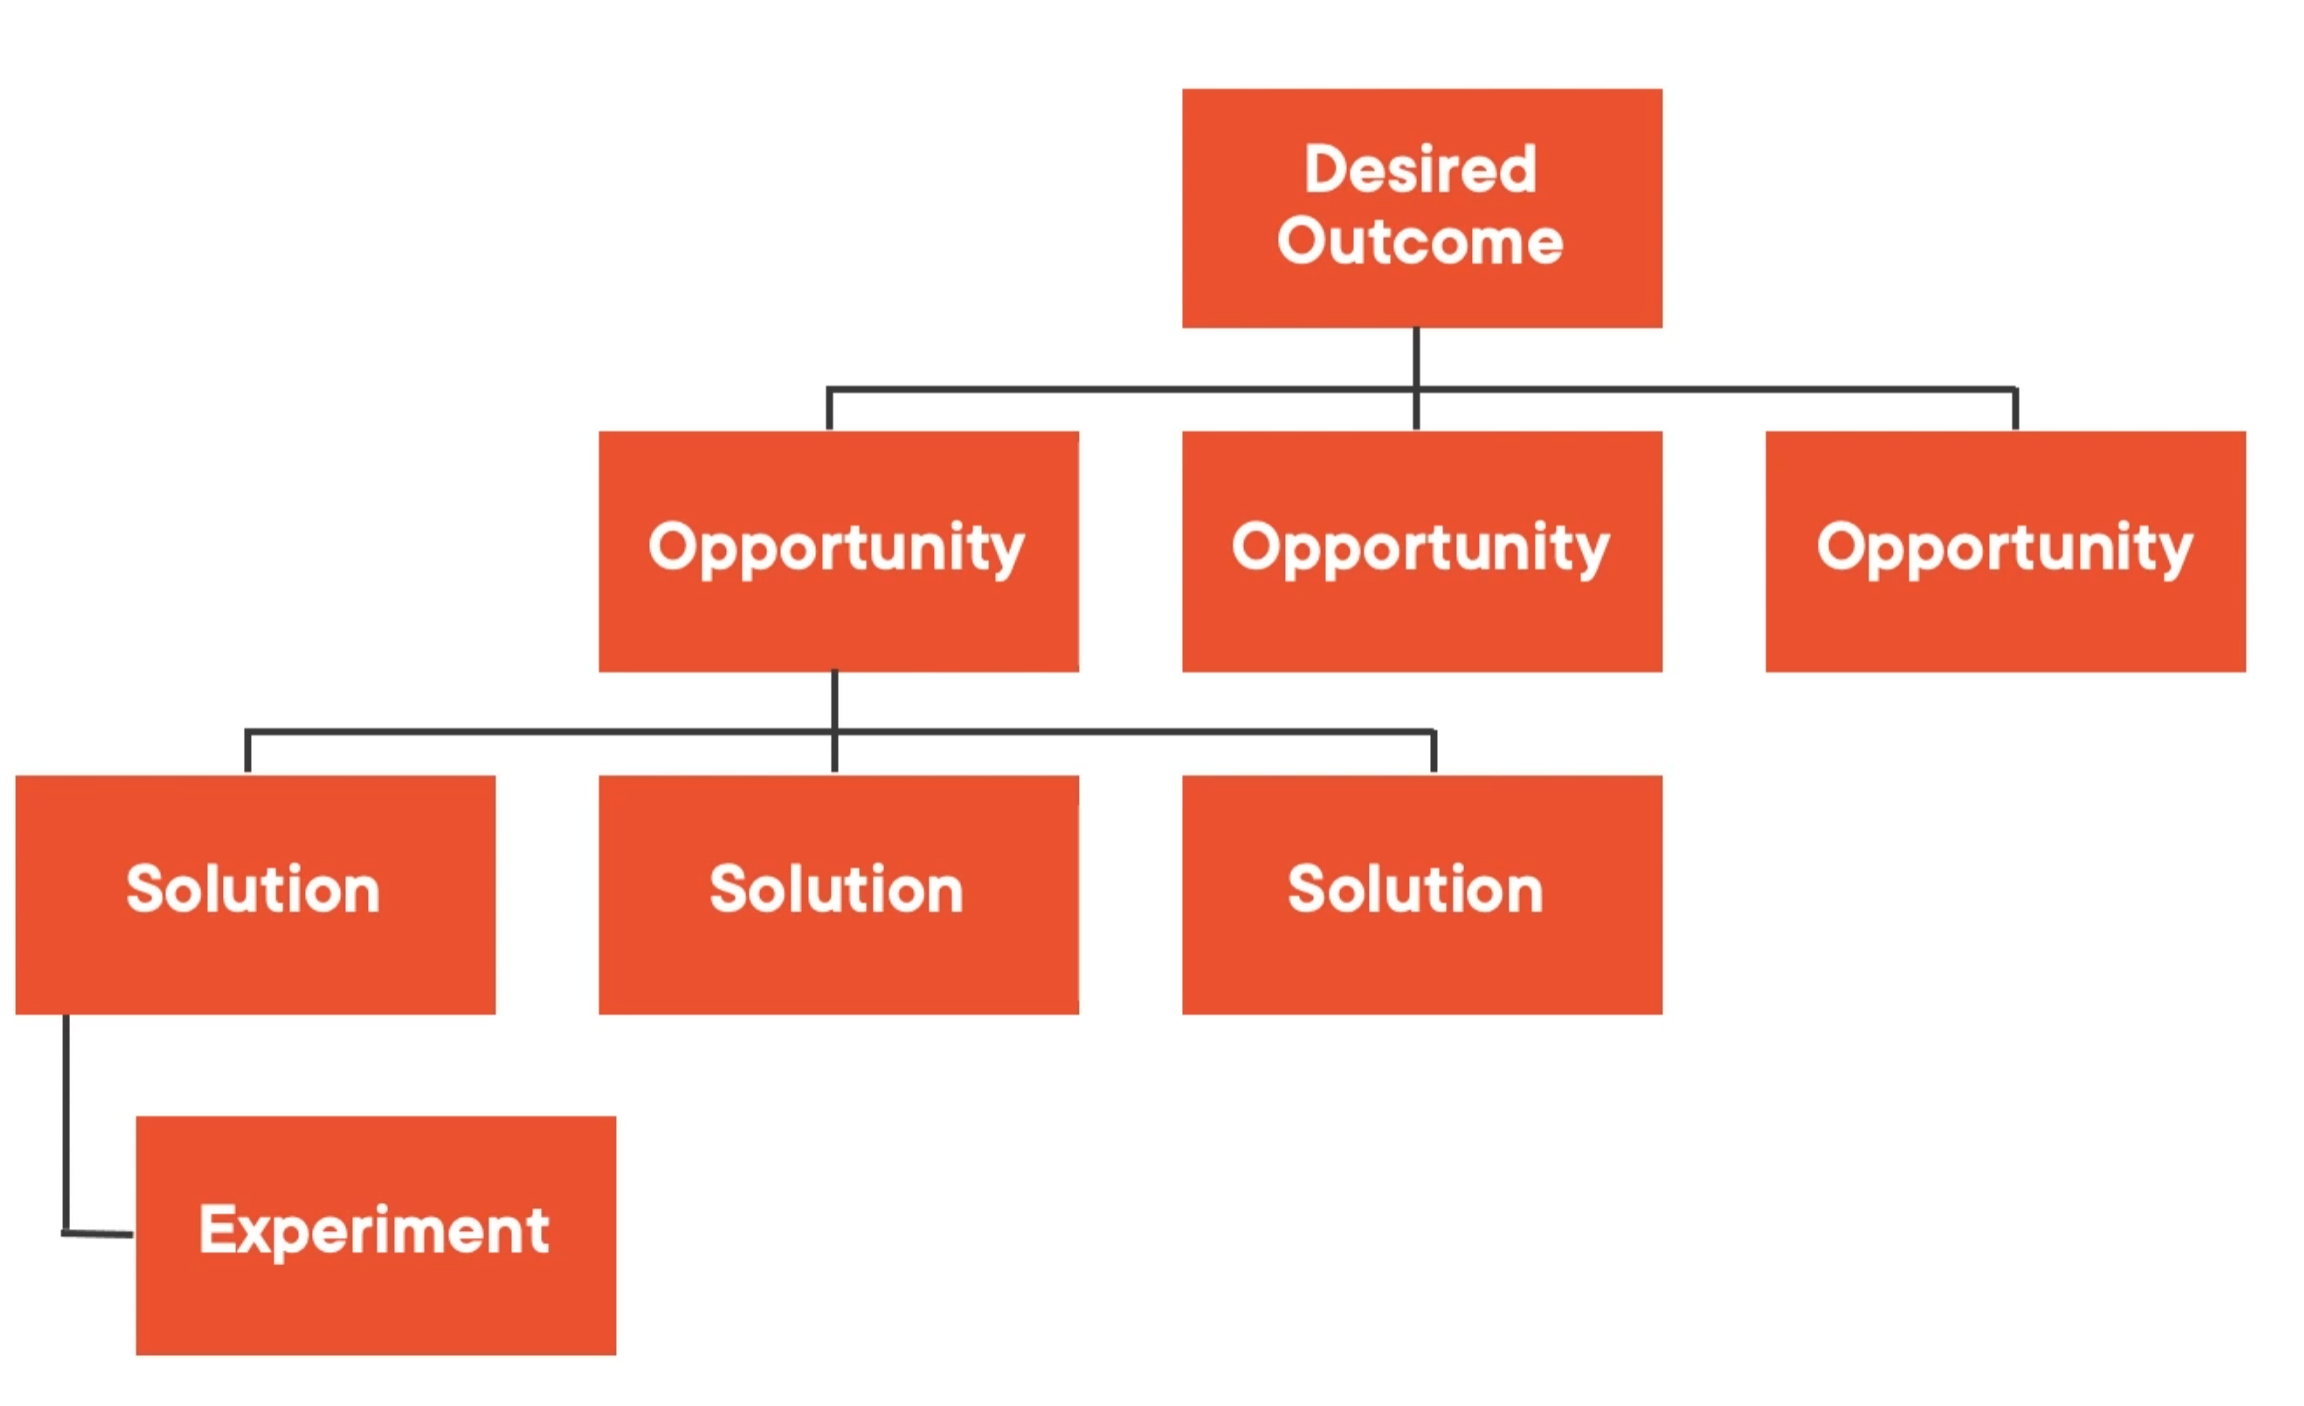
An example of a completed opportunity-solution tree could look like this:
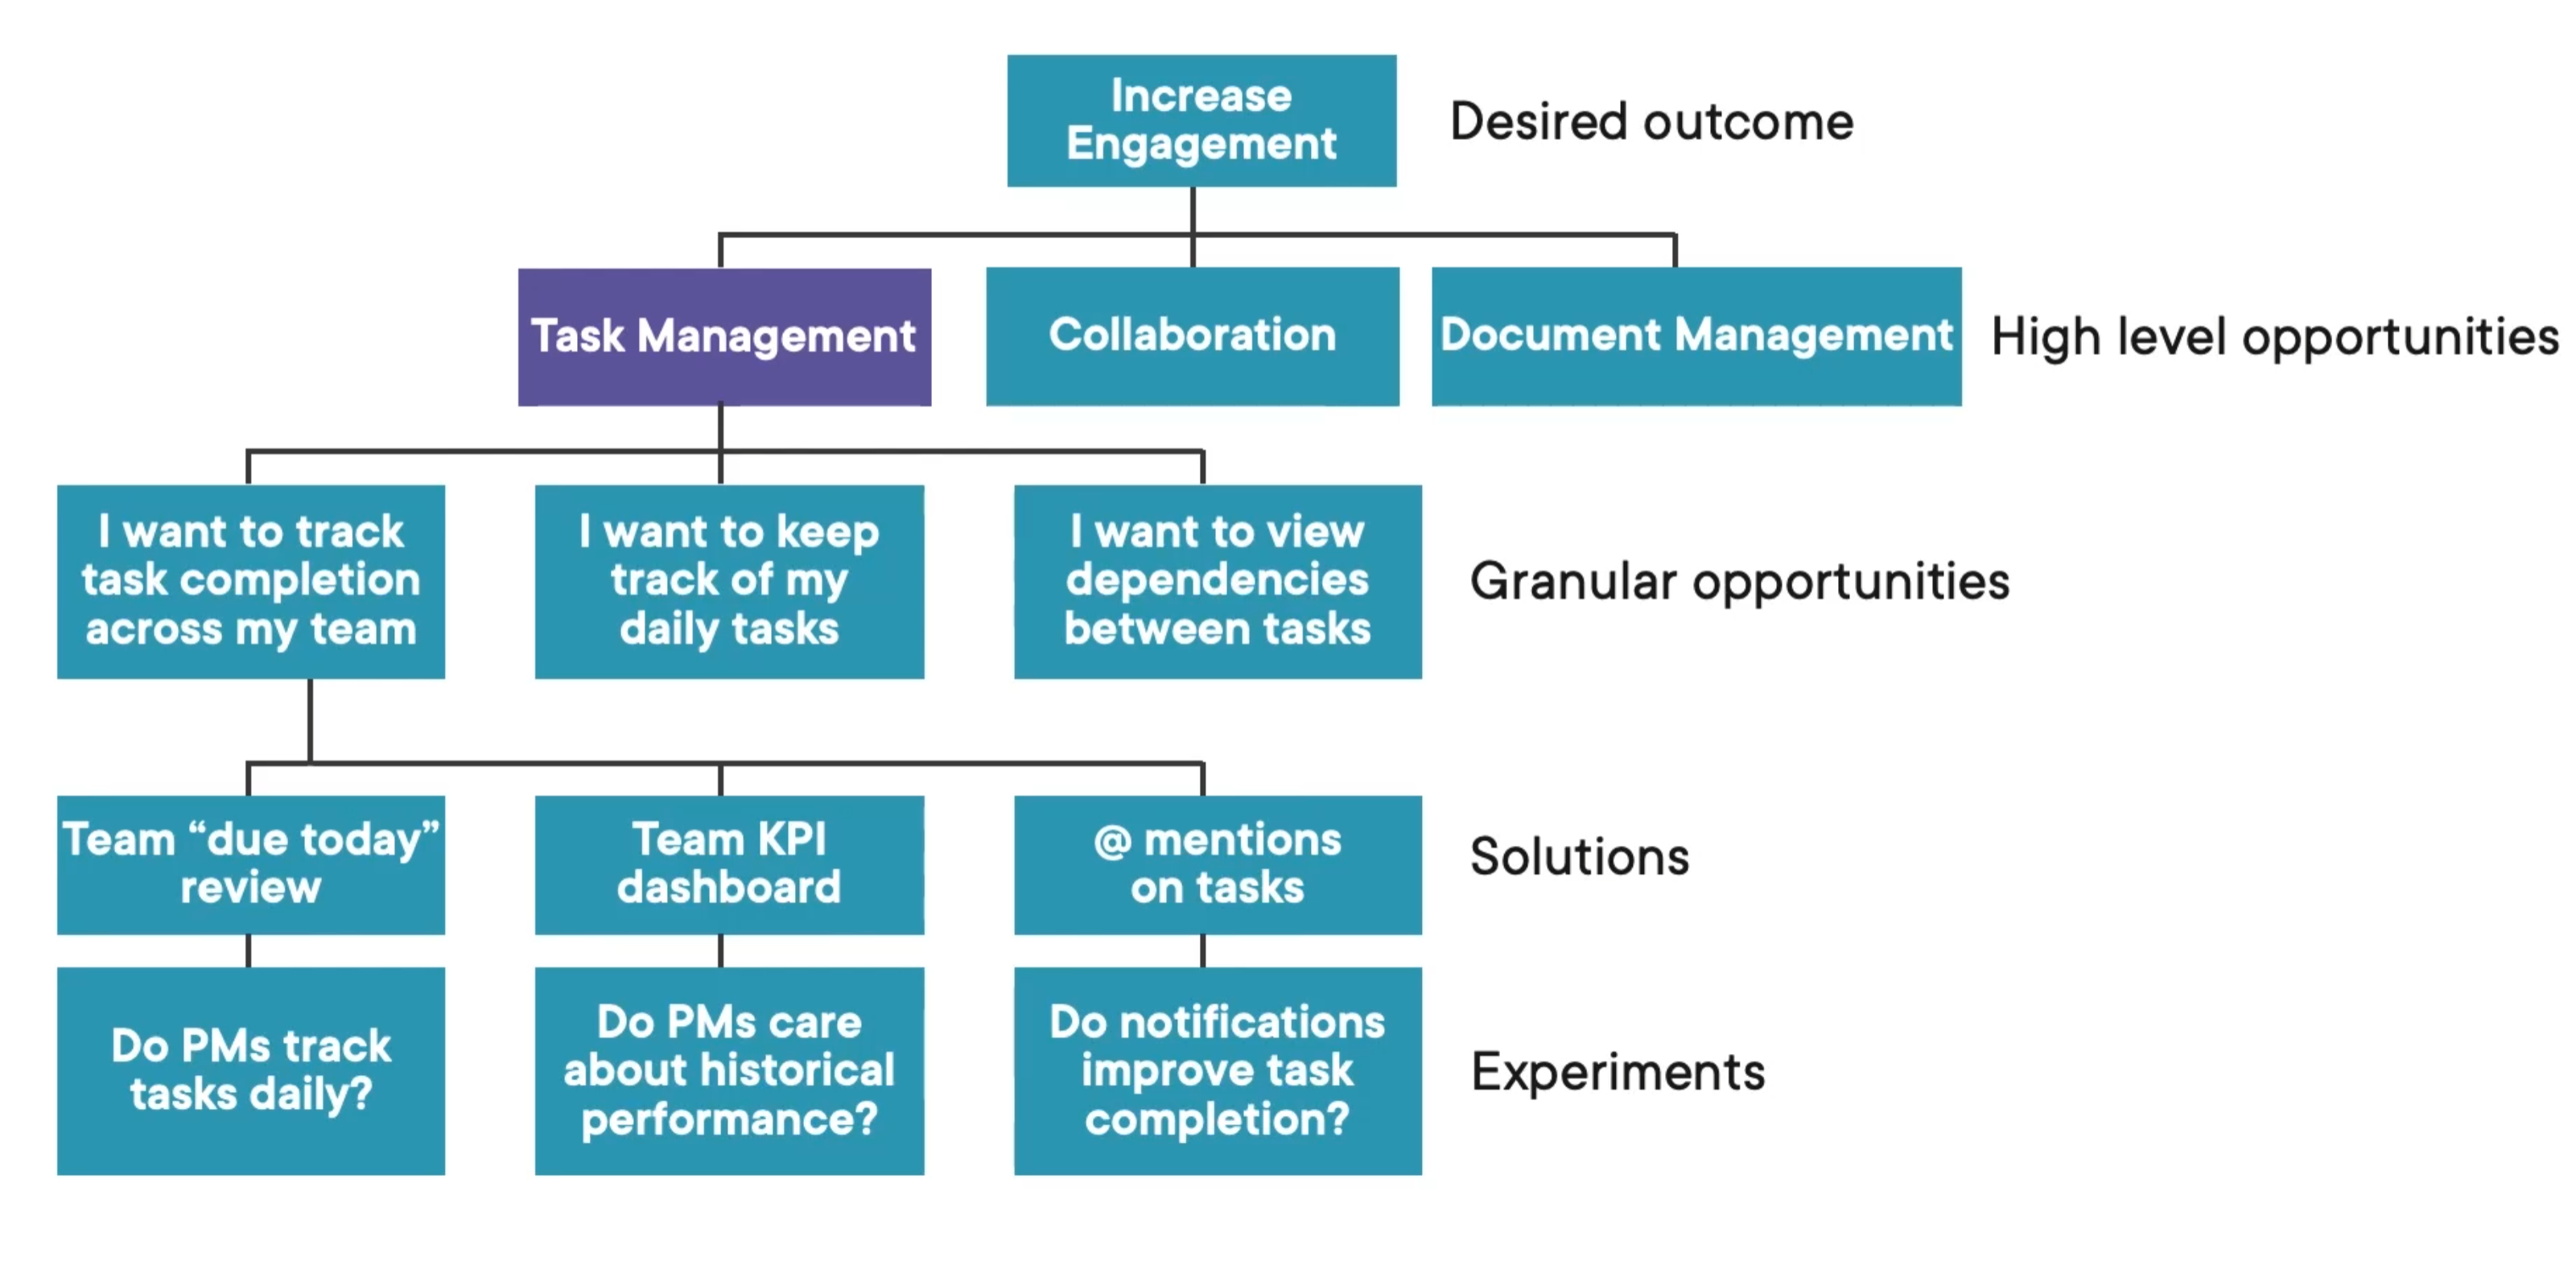
Opportunity-solution trees are powerful because they allow you and your team to visualise and structure your thinking. Rather than just throwing ideas around and letting opinions win the day, you can use this structure to identify your overall objective and work down from there, prioritising as you go and making sure you don't just jump in on the first idea that is thrown out.
Story Mapping
When you think of a backlog, you probably think of a list of items like user stories and epics in something like Jira. As product people, we always have more things we'd like to build than we have time for, so we have to prioritise. In a backlog, the most important stuff goes to the top. Simple. But when you organise all your stories by priority, you lose the context for those stories. How do they fit into the larger picture of your product? If you evaluate each story in isolation, there's a good chance that your product will become a bag of bits. Story mapping is an attempt to solve this problem. Rather than placing user stories in a linear backlog, it places them along the user's journey through your product.
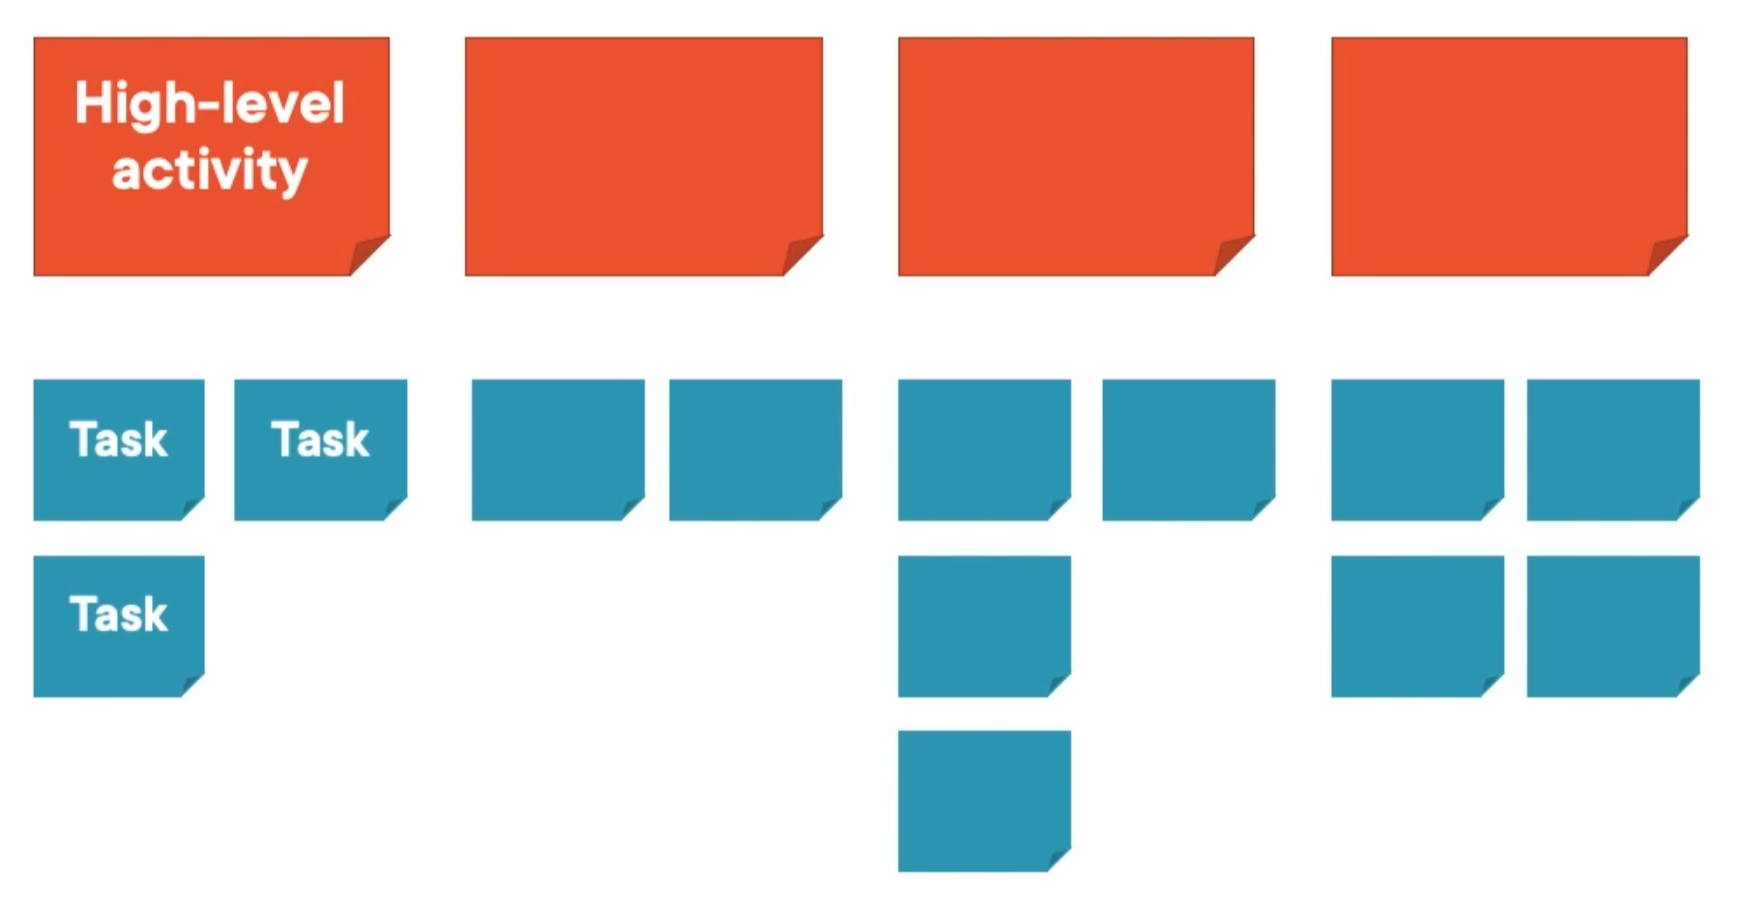
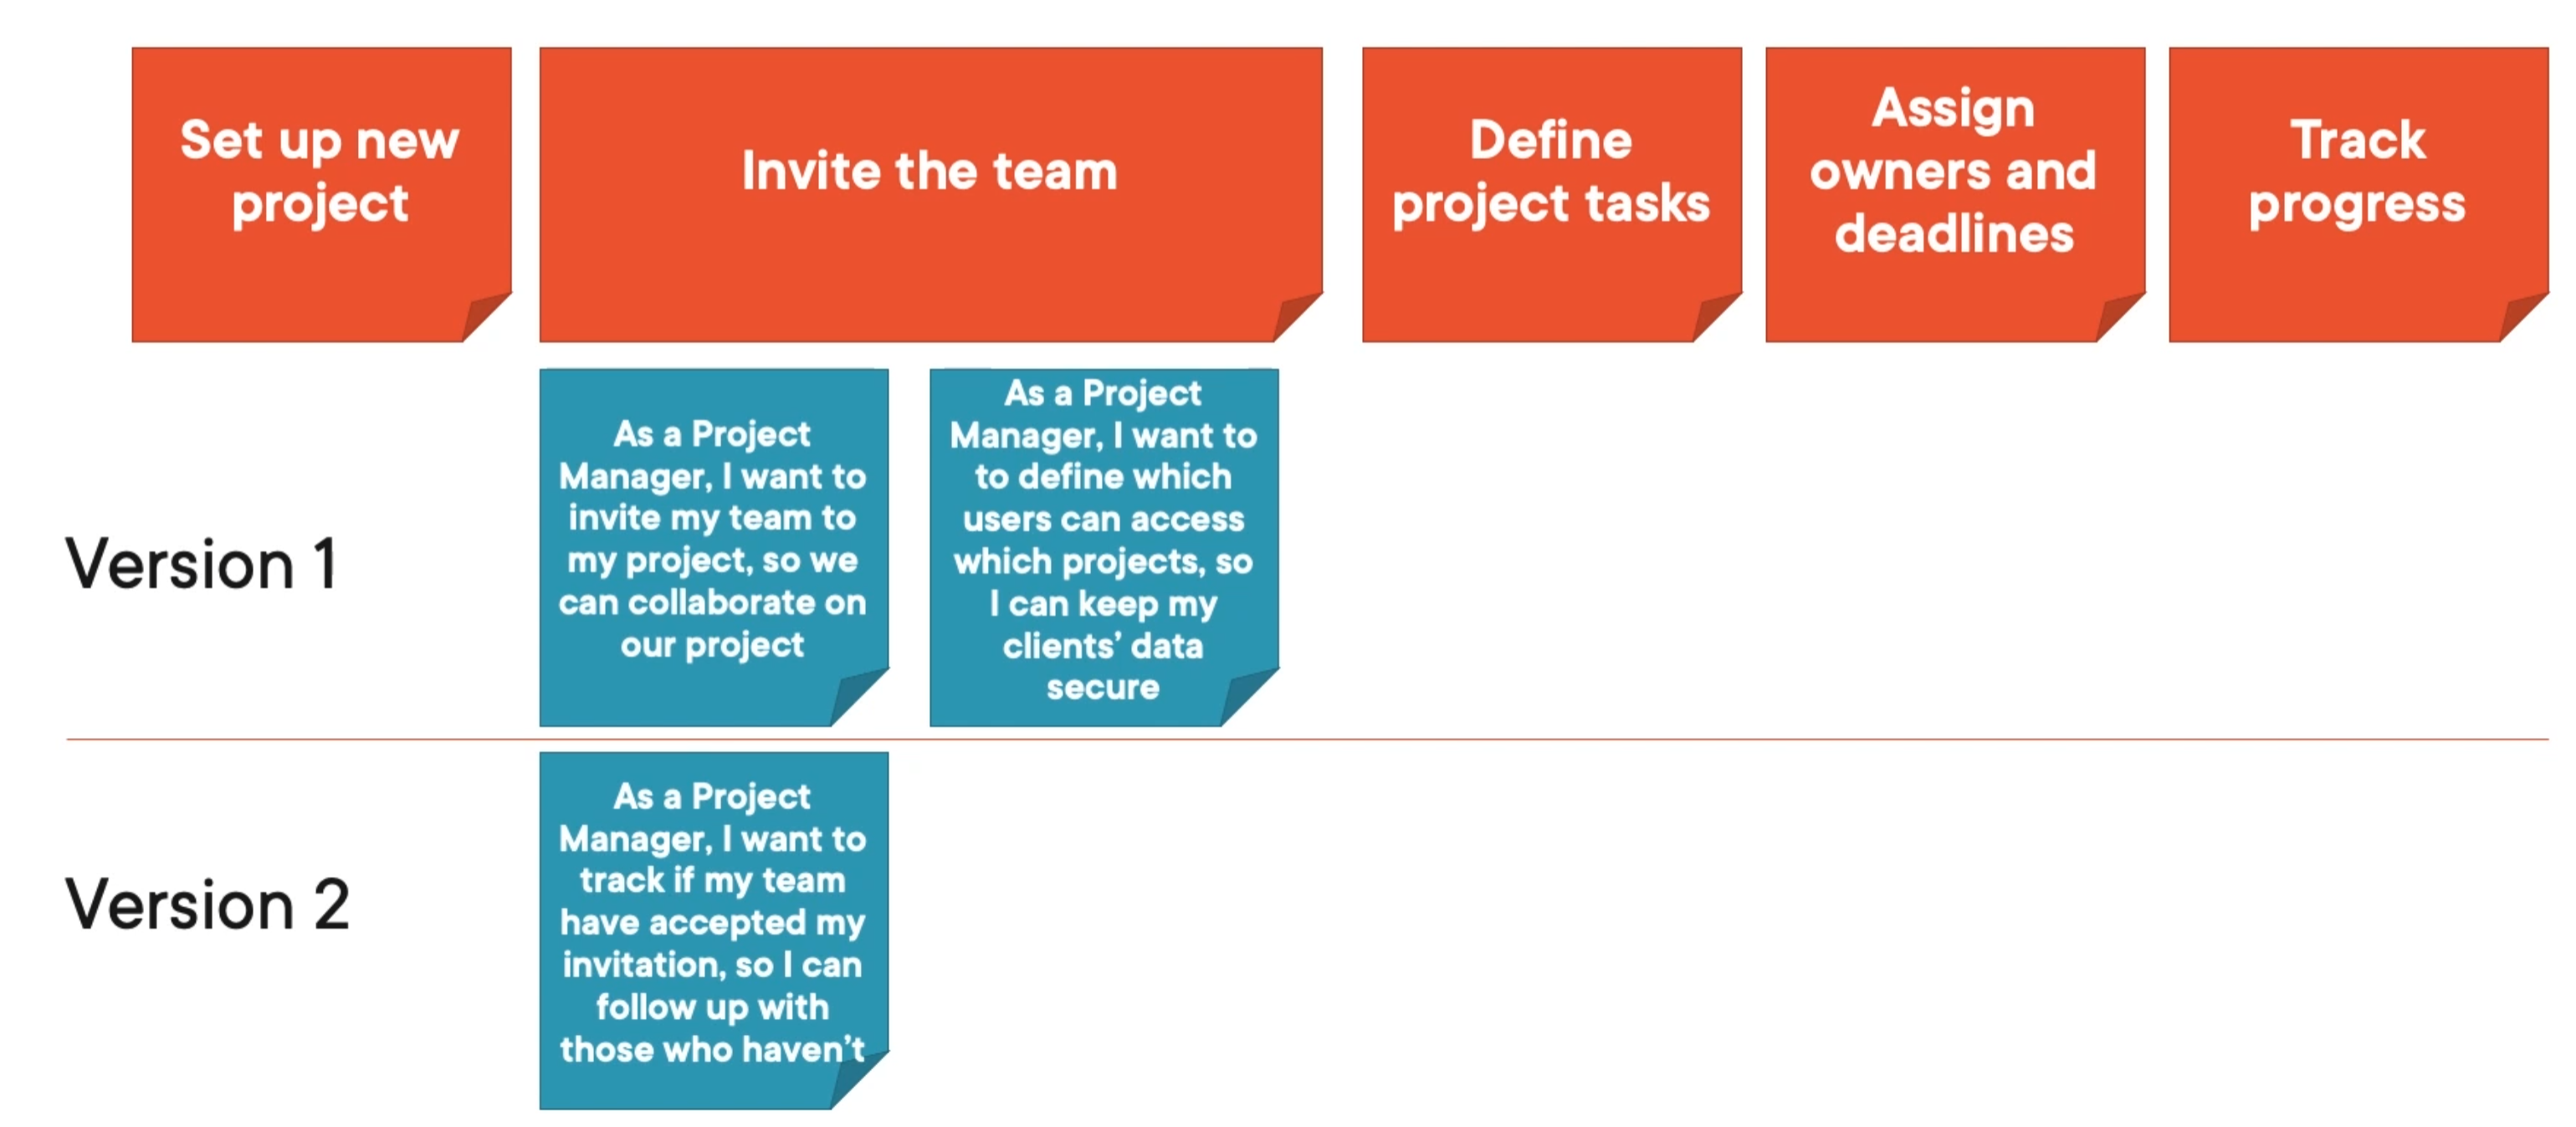
Our high‑level activities might be setting up a new project, inviting the rest of the team to collaborate, defining the tasks in a project, and tracking the project's progress towards going live. If you're unsure which orders some user activities happen in, look at your user data or make an educated guess. The important thing is to get these high‑level activities down on paper. Because these activities are macro things that a user does in a product, they're often the essentials of your product. There's no prioritisation at this level because each activity is required to some degree. Without one of these activities, there's no functioning product.
Next, plot the smaller tasks on your story map under the activities. These are the more specific things a user does to complete the larger activity. Just as epics break down into stories in a typical backlog, a similar concept applies here. You can also start to prioritise at this stage, placing the most essential tasks closer to the top. In theory, taking a thin slice of the most essential stories gives you a coherent minimum viable product. The next layer could be version 2, and so on.
RICE
The RICE framework was developed by Intercom and stands for:
- Reach
- Impact
- Confidence
- Effort.
You can calculate a RICE score by multiplying reach, impact, and confidence together and dividing by effort.
Reach assesses the number of customers or users this idea will affect in a given period. In most cases, reach should be quantifiable based on your existing product data. For example, in a given month, you could look at how many people access the part of the product where this idea is located, or you could look at how many people reach the relevant step in the funnel, and so on.
Impact is the degree to which the idea will likely improve your customers' experience and move you towards your goal. The impact may be harder to measure than reach, but you can typically compare ideas on the impact dimension.
Confidence allows you to weight your reach and impact estimates by how much evidence you have for them. Ideas come from all sorts of places; some developed from rigorous research, while others come from teammates, stakeholders and users. Using confidence in your ranking allows you to deprioritise the hot new idea that has little evidence behind it, or you could choose to prioritise a small research project to gather more data on that particular idea. If in doubt, do research.
Effort is a measure of your team's resources. How many person days is an idea estimated to take? Obviously, the Holy Grail is an idea that has high reach, impact, confidence and low effort. Most ideas fall at different points on all those dimensions. The effort is the counterweight to the other factors that reflect the fact that you have limited resources.
The Kano Model
The Kano Model helps us assess how satisfied customers might be with the different features we are considering. Kano's model considers features on two axes, satisfaction and functionality. Satisfaction is our goal for our customers, and this axis ranges from delight to dissatisfaction or frustration. The functionality axis measures how much of a feature the customer gets and how well we've implemented it. To achieve full functionality will require significant investment, so this axis can also be thought of as the degree of investment we make in the feature.
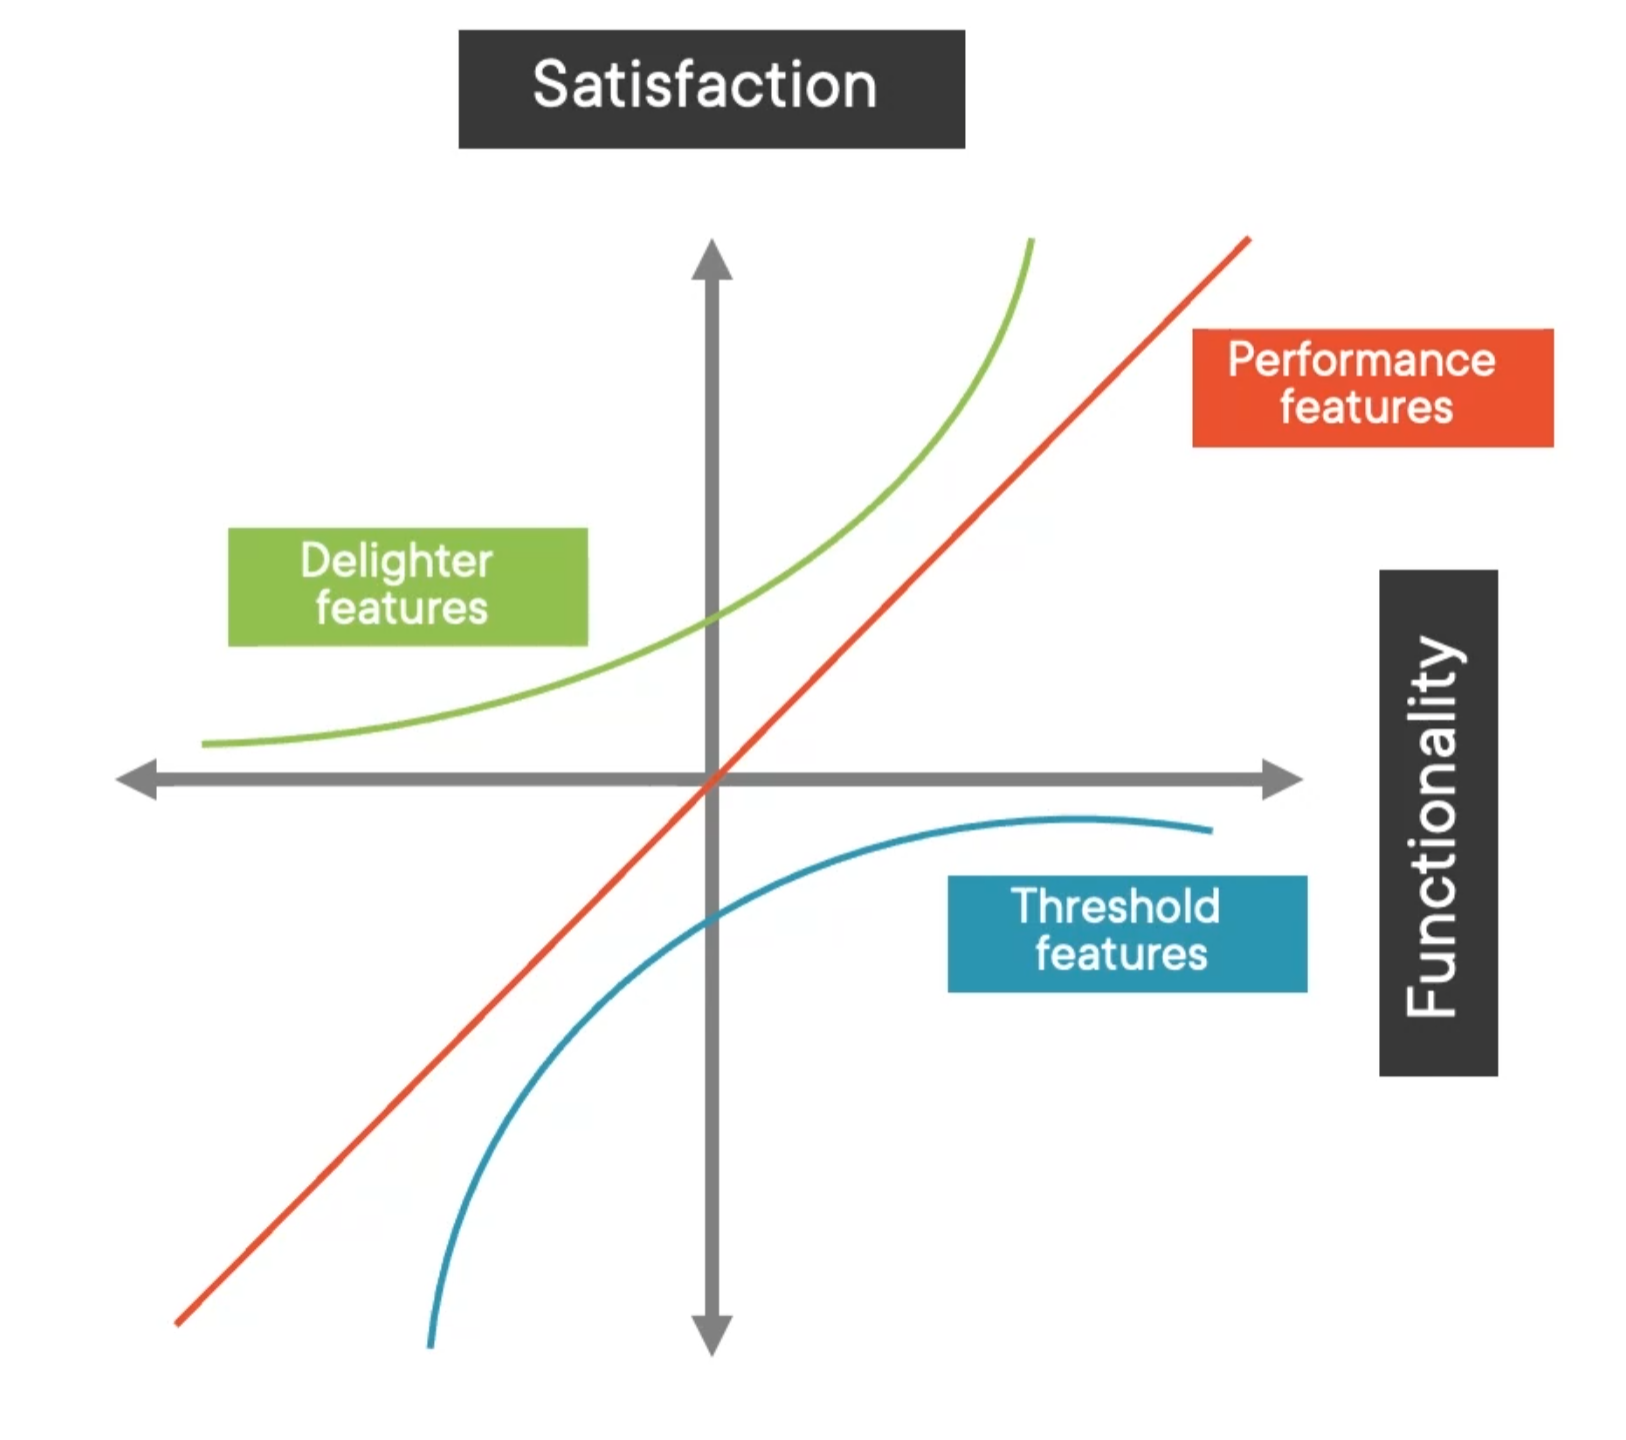
Performance Features - with these features, customers are more satisfied the more they get out of the feature. An example might be the amount of storage space each account is given.
Threshold Features - these can also be called 'must‑have' features because they are customers' expectations. If our product doesn't have these features, customers will consider it inadequate or incomplete. The good news is that even a little investment in these features goes a long way towards increasing satisfaction, even though we'll never cross that midline with these features alone.
Delighter Features - these features are almost like the inverse of our threshold features. Customers keenly feel the absence of threshold features in a negative sense. By contrast, customers don't notice the absence of delighter features because they are unexpected. But these features have the potential to be your secret source because they can create huge increases in customer satisfaction with even a little investment. All wildly successful products have introduced the world to some new, delightful features. Think about the iPhone's touchscreen, for example. Identifying these delighter features is tricky; you can't simply look at others and copy them. Remember, when someone releases a truly delightful feature, others will copy it, and it will start to become another threshold feature.
The North Star
The North Star framework is a model for managing products by identifying a single, crucial metric (the North Star metric) that can be used to measure the success of the product you deliver to customers. It defines the relationship between the customer's problems that the product team is trying to solve and the revenue the business aims to generate.
The North Star framework includes a set of key inputs that collectively act as factors for producing a North Star metric. A North Star metric should consist of 2 parts:
- a statement of your product vision and
- a metric that serves as a key measure of your current product strategy.
The combination of the North Star metric and inputs can help the company:
- prioritise and accelerate informed decision-making.
- align and communicate between teams
- enable teams to focus on impact and product-led growth
The Elements of the North Star Framework
The North Star Metric
The heart of the North Star framework is the North Star metric, a single metric that captures the core value that your product delivers to customers and represents your product strategy. This metric is an essential tool for navigating your business. It’s a number that allows you to measure how successful or unsuccessful you are in achieving your goals and growth. The North Star Metric also includes key inputs that are both descriptive and actionable.
The metric shouldn’t be something obscure or abstract (for example, 'more customers' or 'higher customer retention') because obscure metrics don't make great KPIs to measure how well you’re meeting your north star. The key is to figure out what data point(s) will help you stay on track throughout the year but also be accessible for all your team members to understand and communicate and stay aligned around what matters most when making decisions about new features or products.
Inputs
The inputs are a small set of influential, complementary factors that directly affect the North Star metric and can provide influence through the product strategy. Inputs can vary by industry, business models, and a product’s unique characteristics. Identifying the key inputs that contribute to the North Star metric for your business is important.
The Work
A North Star metric and inputs should be connected to the tasks of research, design, prototyping, development, refactoring, testing, etc. This is the work that goes into researching, designing and developing a product. All the teams involved have successfully connected various development methods to their North Star. No matter how your team operates, the work completed should align with the product strategy that your North Star guides.
Results and Value
Once the North Star metric and inputs have been identified, and the product strategy is put into action, you should see a change (ideally a positive change) to your business results and the value of your business and product. This could come in the form of greater customer acquisition or increased customer satisfaction leading to more revenue through new sales or upsells.
An Example
An example of using the North Star framework could be when introducing a recommendation platform to an e-commerce site. The North Star metric could be the 'average order value' increasing as recommended products get more attention on the online store. Below are some intermediate metrics that can be used to track how the average order value will change with this new feature:
- % of customers who clicked on a recommended product
- % of customers who added a recommended product to their basket
- % of customers who bought a recommended product
- % of customers who visited the site based on emails that showed the recommended products
However, there are other factors (or inputs) that can influence the North Star metric as they have an overall effect on the recommended products. Metrics such as:
- the quality of the recommended products
- inventory levels
- distribution capabilities
- shipping costs
- the current economical environment
- are the recommended products seasonal?
All of these, and more, will have an impact on our North Star metric.